Graphing Lines | ||
| ||
Introduction | ||
In this section, you will learn how to graph lines in slope-intercept form and in standard form. Here are the sections within this lesson:
|
Graphing lines is important because there are many relationships that are linear. Or, sometimes people simplify complicated relationships into linear relations to approximate answers. Look at this situation.
A certain stock drops $2 every three days. A stock trader wants to know the value of the stock over time given the starting price is $50. Having precise knowledge of this de-escalating stock price is incredibly valuable to a trader. It allows the trader to determine when to sell. So, we need the value of this stock and will represent it as a linear function within the next section, called y-intercept.
These linear relationships are not restricted to dealing with stocks. They are used for all sorts of situations where values rise and fall over given intervals.
| |
To graph a line in slope-intercept form, we have to first understand what the terminology means. The y-intercept of the line is the location where the line intersects (crosses) the y-axis (the vertical axis). For instance, we may need to graph this line, which defines the falling stock price that was described in the previous section: rationale.

The y-intercept is the value off on its own, the 50. We also call it the constant term because the term does not contain a variable.

Since the y-intercept is 50, I know the line crosses the y-axis at 50. This picture is a visual indicator of where the line crosses the y-axis.
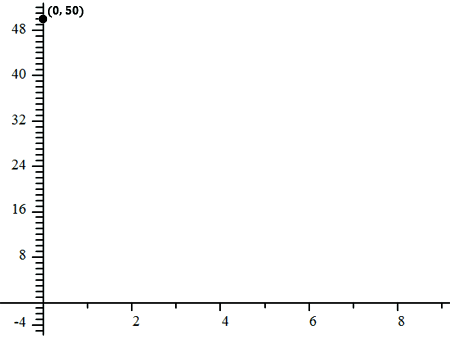
| |
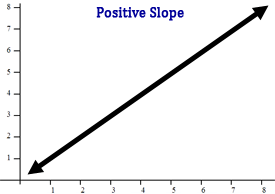
The slope of a line indicates how the line is slanted in a coordinate plane. Lines with a positive slope are slanted to the upper-right of the plane.
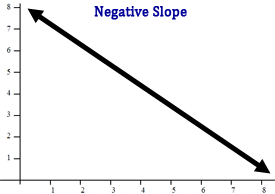
Lines with a negative slope are slanted to the bottom-right of the plane.
Slope is defined as rise over run.

For instance, examine the equation of the line that was used above.

The slope of the line is the coefficient of the x-term.

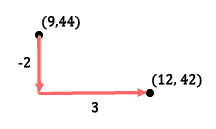
The slope of the line is -2/3. The ‘rise’ is -2 and the ‘run’ is 3. This is basically a direction of how to go from one point on the line to the next point on the line. If (9, 44) is a point on the line, then we must ‘rise’ -2 and ‘run’ 3 to get to our next point. So, we will go down 2 and right 3, as seen here.
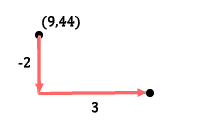
Our next point is therefore (12, 42).
| |
y = mx + b | |
If we want to graph a line that is in slope-intercept form, we first have to recognize the form. It’s called slope-intercept form because it is easy to locate the slope and the y-intercept. When the equation has the y-value alone and the coefficient is one, the equation is in slope-intercept form. This equation is in slope-intercept form.

The y-intercept is the number by itself, which is the constant term.

50 is the location on the y-axis where the line crosses it. As our first step, we place a point on that location, like so.

We will have to use the slope for our next step. The slope is the coefficient of the x-term.

So, the slope is -2/3. From our first point, which is at (0, 50), we can get to our next point. We will ‘rise’ -2 and ‘run’ 3. This will make us go down 2 units and right 3 units.
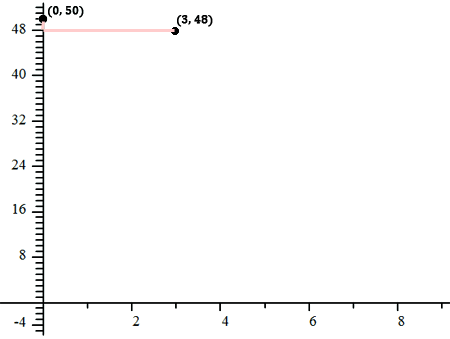
If we take a closer look at the graph above, this microscopic view can reveal the slope. The slope makes us go down 2 units and right 3 units.

We now have two points on our line. We can connect them to form our line.
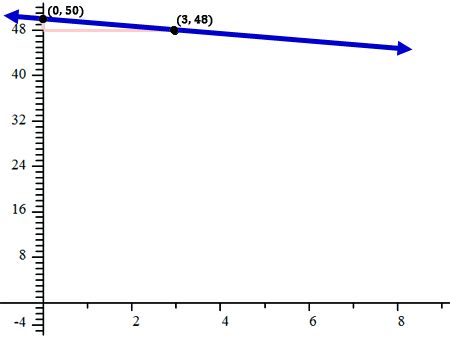
Let’s take a look at another example. Here is another equation.

The y-intercept is the constant term.

Place a point on the y-axis at (0, -4).
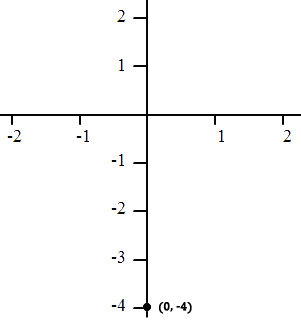
The slope of the line is the coefficient of the x-term. Instead of looking at the coefficient as an Integer, we can make it into a fraction by placing a one underneath it. Mathematically, it is the same value.

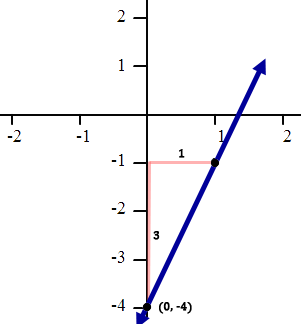
The slope is 3/1. To continue graphing, we need to move from (0, -4). We will ‘rise’ 3 and ‘run’ 1.
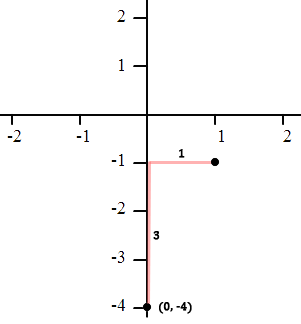
You can see that the new point we found is (1, -1). We will connect the points and sketch our line.
Now it is time to try a problem of your own. Use the interactive quizmaster below to graph a line.
| |
ax + by = c | |
Standard form is different from slope-intercept form. Standard form of a line requires the equation to have the x-value and the y-value on the same side of the equation, like this example.

Notice that both the x-term and the y-term are on the same side of the equation. There are two ways to graph this. The remainder of this lesson will detail those two methods.
Method #1: Graph by Slope-Intercept Form To solve for ‘y,’ first subtract 5x from both sides.

Next, divide both sides by 3.

We have to divide both terms on the right side of the equation by 3. This is what we get.

To graph this equation, follow the steps we used for graphing lines in slope-intercept form above.
Method #2: Graph by Intercepts To understand how to find those locations, we need to realize that points on the x-axis have y-values equal to zero. Look at points A, B, and C on the following coordinate plane and determine their coordinates.
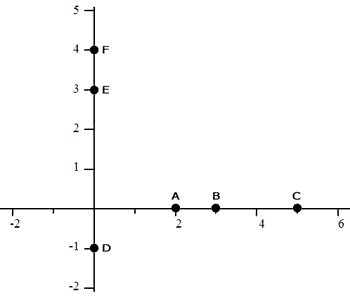
Point-A is at (2,0). Point-B is at (3,0) and point-C is at (5,0). Likewise, find points D, E, and F on the y-axis. They all have x-values equal to zero. D is at (0,-1), E at (0,3), and F at (0,4). The important piece of information is this. The x-intercept of a line -- the location where a line crosses the x-axis -- always has a y-value of 0. Conversely, the y-intercept of a line always has an x-value of 0. Look at the points above to review this crucial fact. This means we can find the x-intercept of our line by replacing the y-value with 0. Let’s see what happens when we do that for our equation.
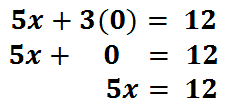
We will now solve the equation for ‘x.’ We will divide both sides by 5.

This is our solution for 'y.'

The fraction 12/5 is equal to 2.4. Since we substituted zero for ‘y,’ our y-value is 0. This means the line crosses the x-axis at (2.4, 0).
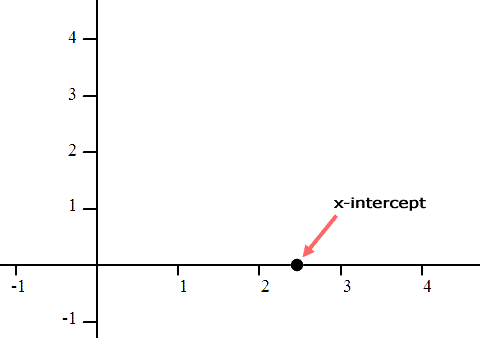
To locate the y-intercept, we need to substitute zero in for ‘x.’
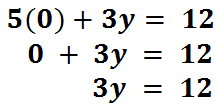
To solve for ‘y,’ we need to divide both sides by 3, like so.

Finishing up, we get our solution for 'y.'

We substituted zero in for ‘x’ and the result was ‘y = 4.’ This means the y-intercept is located at (0, 4).
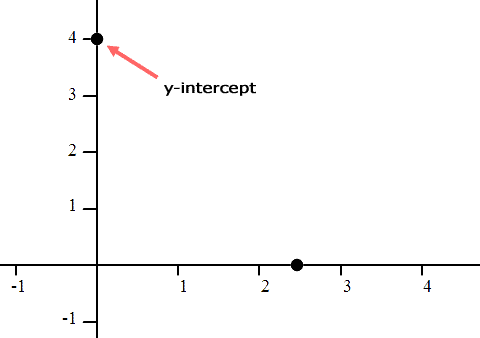
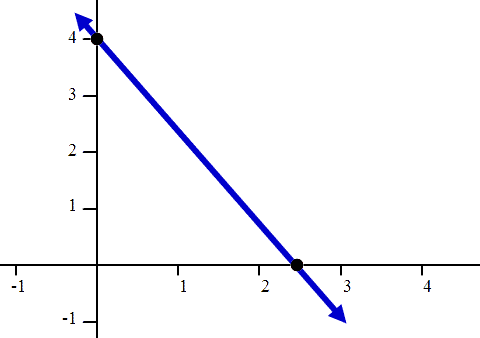
Now that we have two points in our coordinate plane, we can connect them to finish graphing the line.
Now it is time to try a problem of your own. Use the interactive quizmaster below to graph a line.
| |
Try our instructional videos on the lessons above.
| |
Try our interactive quizzes to determine if you understand the lessons above.
| |
Try these advanced lessons, which are closely related to the lessons above.
| |
 ideo:
ideo:  uizmaster:
  esson: