Piecewise Functions | ||
| ||
Introduction | ||
In this section, you will learn how to graph piecewise functions. Here are the sections within this lesson:
|
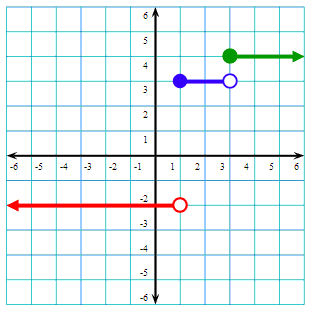
This function, f(x), is a beginner level problem because it is composed of three simple functions melded together into one function.
The function f(x) has three sections, which indicates there are three pieces to the graph.
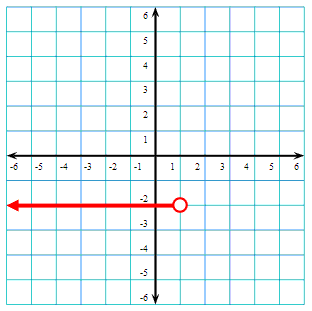
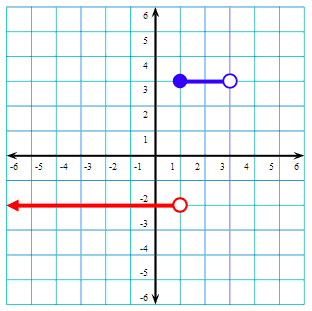
Each section is a horizontal line bound by different conditional statements. The conditional statements (statements with inequalities) are domain values and the function values (numbers to the left) are range values. To graph the red section, we will graph the horizontal line, y = -2, but only with the domain values (x-values) less than 1, like so.
Likewise, we will graph the next section of the graph, which is another horizontal line. However, this blue horizontal line, y = 3, will be graphed between x = 1 and x = 3, like so.
Next, we will graph the final horizontal green line, y = 4, when the x-values are greater than or equal to 3, like so.
View our video on this beginner level problem. | |
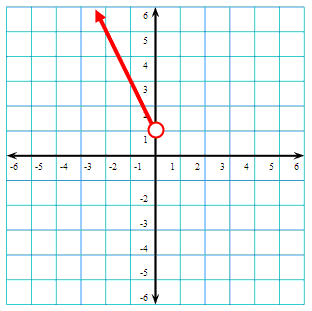
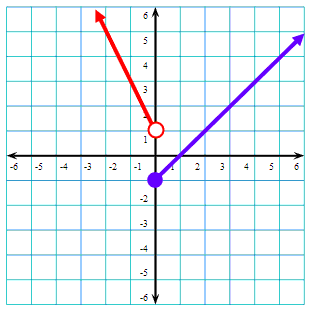
This function, g(x), is an intermediate level problem because it is composed of non-horizontal linear functions melded together into one function.
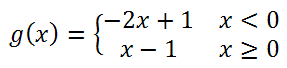
The function g(x) has two sections. By reviewing the conditional statements x < 0 and x > 0, we can see that the critical domain value is at x = 0. This will explain why the coordinate plane will be split into two sections: everything left of x = 0 and everything right of x = 0. To graph the section left of x = 0, we will graph the function that states x < 0, which is y = -2x + 1, like so in red.
Next, we will graph the section right of x = 0 when x > 0, which is y = x - 1, like so in blue.
View our video on this intermediate level problem.
| |
This function, h(x), is an advanced level problem because it is composed of several sections and one of them is a non-linear function.
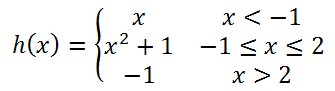
The function h(x) has three sections. The first piece of the function is linear. It is the line y = x and only the x-values less than -1 must be graphed. Here the function is shown in red.
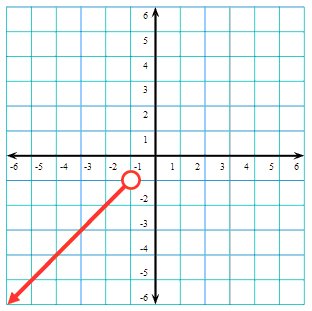
Next, we will graph the piece where -1 < x < 2. In other words, we will graph the parabola between x = -1 and x = 2, which is done in blue.
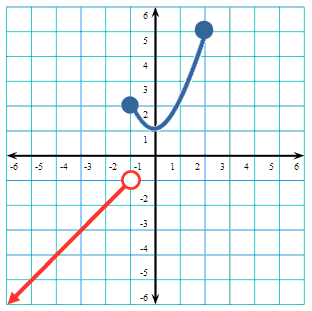
Last, we will graph the piece where x > 2, which is everything right of x = 2. We will graph the horizontal line y = -1 in that zone in green.
View our video on this advanced level problem. | |
Piecewise functions are strongly tied to domain and range. The pieces are defined using functions or relations along with a specified domain (or sometimes range, like a vertical line). This activity requires students to use pieces of functions and relations.
| |
Try this lesson, which is closely related to the lesson above.
| |
 ideo:
ideo:  ctivity:
  esson: