Limits of the Extreme | ||
| ||
Introduction | ||
This lesson page will inform you how to calculate the limit of a function for extreme values. Here are the sections within this lesson page:
|
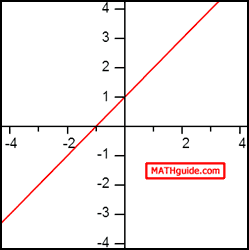
When we examine functions, we look at specific values and evaluate those functions [see our lesson: Evaluating Functions] at those values. While looking at the function f(x) = x + 1, we can evaluate it at x = 4, for instance. We write that evaluation as f(4) = 4 + 1 = 5. The x-value is 4 and the corresponding y-value is 5. We can also examine the graph of this function, which is a line.

The graph can be used to quickly evaluate the functions at various x-values. The graph can also be used to see a general trend or pattern.
| |
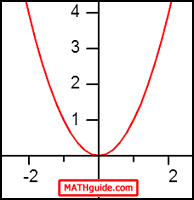
Limits behave differently compared to the evaluation process of functions. Instead of finding y-values for specific x-values, we look to see where the trend for y-values approaches as we get closer and closer to certain x-values. The paragraph above can best be understood when we examine the graphs of functions. Let us look at the graph of g(x) = x2, drawn below.

If we wanted to know what is happening to the y-value as the x-values are getting bigger and bigger, we can simply look to the right side of the graph. As x-values increase, the y-values increase. We can also write this symbolically, which we will see within the following sections.
| |
Limits can be expressed symbolically. Take this limit of g(x) = x2.

The expression above is pronounced as Ďthe limit as x approaches infinity of g-of-x.í It means exactly the same meaning as was described within the last section, Limits as a Trend. We keep moving to the extreme right side of the graph and look to see what is happening to the y-values. By examining the graph, we can see that the y-values are getting greater and greater, without bound. This means that the y-values are moving toward infinity.
Note: Infinity is not a number. It is a notion that means a value without bound or a value that will increase forever.
| |
Letís assume for this example that h(x) = x3. Let's calculate...

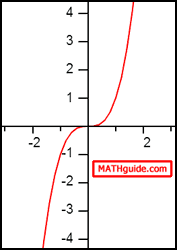
This graph looks different than the graph of g(x). We saw that g(x) goes up on the right side of its graph and up on the left side of its graph. However, h(x) behaves differently. Here is the graph of h(x).

It can be seen that h(x) goes up as we move to the extreme right-side of the graph. Conversely, as we move to the extreme left-side of the graph, h(x) goes down. Returning back to the notation of our problem, the limit states that we are looking at the graph as x approaches infinity. This means we move to the right side of the graph and observe the y-values, which are going up without bound. This means that the solution to our problem is infinity.

| |
Letís assume for this example that...

...and we wanted to calculate...

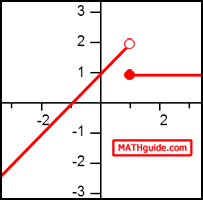
For this example, we have to know something about Piecewise Functions. By graphing this piecewise function, we will better be able to evaluate the limit. Here is the graph of k(x).

To calculate the limit of the function as the x-value approaches smaller and smaller values (negative infinity), we have to look at the far left side of the graph and observe what is happening to the y-values. The curve continuously moves down as we move to the left. This means the y-values are also getting smaller and smaller. This means...

| |
Take a look at the same function, k(x).

We will calculate this limit.

This time we will observe the graph (see previous section: Example 2) to determine what happens as the x-values get larger and larger. By looking at the extreme right side of the graph, we can see a trend. As we move to the right, the y-values neither increase nor decrease. They simply stay constant, at a y-value equal to 1. Therefore...

| |
Try these lessons, which are related to the sections above.
| |
 esson: