Inequalities | ||
| ||
Introduction | ||
In this lesson, you will learn about inequalities. Here are the sections within this lesson:
|
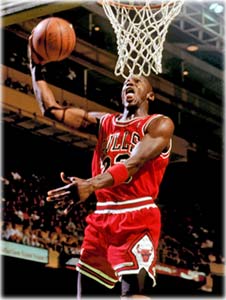
There are many things in the universe that can be represented with inequalities. For instance, the number of grains of sand on Earth is greater than the number of servings of breakfast cereal one can eat in a day. The number of times one can repeatedly fold a sheet of paper in half is less than ten (probably no greater than seven)! We even compare heights: Michael Jordan is taller (has a greater height, 6ĺ6ö) than Danny DiVito (4ĺ11ö).
| |||
Algebraically, we use symbols to represent these relationships. For instance, if someone says, ĹI will pay you less than $20 to shovel my driveway,ĺ we could write it using symbols asů
ůwhere Ĺpĺ represents pay. This verbal contract says Ĺless than,ĺ which means you cannot be paid $20 but you can be paid less than that amount. Be careful because an acceptable payment for this verbal contract could be a penny or $0.01. If we say ĹThe time it takes to paint that room is not less than 2 hours,ĺ we can write this tough expression asů

The words Ĺnot less thanĺ means Ĺgreater than or equal toĺ because Ĺgreater thanĺ is the opposite of Ĺless than.ĺ The equality part is a bit tricky to explain. However, if someoneĺs height is not less than Michael Jordanĺs height, that someone could be either equal to his height or greater than his height.
| |||
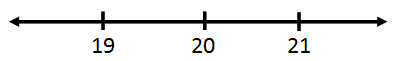
Graphically, we use number lines to represent these algebraic statements and their solutions. We use a number line when the verbal and/or algebraic statements involve a single variable. For instance, let us graph this inequality that we encountered in the last section.
We will use a number line and place the value 20 smack dab in the middle of it.
Since there is no equality, we must place an open circle on 20.
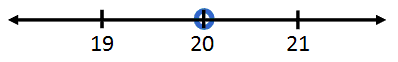
The inequality is Ĺless than,ĺ which means we shade all values less than 20. This requires us to shade to the left of 20, like so.
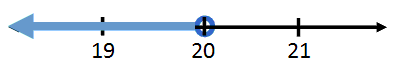
This is the graphical representation of x < 20. The other inequality can be graphed, too. Recall this inequality.

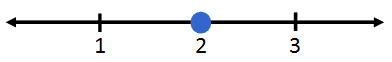
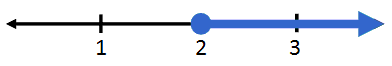
First of all, we have to draw a number line. We have to place the value two in the middle of it.
Second, we have to place a closed dot on 2 because of the equal sign.
Third, we have to decide which direction to shade. We have to shade to the right because the inequality is greater than. We want to indicate all the value greater than 2 should be shaded.
| |||
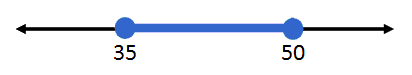
There are situations that arise that involve compound inequalities. For instance, the tire pressure of bicycle tires cannot be too high (too rigid) nor too low (too mushy). For a certain mountain bicycle with thick tires, the pressure cannot exceed 50 psi but cannot be lower than 35 psi. This language is too cumbersome to throw around. Instead, we use a compound inequality to manage it. We can use Ĺpĺ to represent the tire pressure.
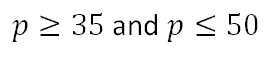
It is preferred to write these two inequalities as one mathematical statement, which can be done for Ĺandĺ statements. If we take the second inequality, we can flip it around to get Ĺpĺ on the right side, like so.
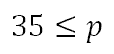
Notice how the inequality had to be flipped in order to preserve the relationship between Ĺpĺ and he value 35. Now, place the two inequalities next to each other.
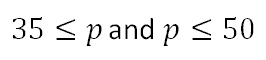
Collapse the inequalities down to one compound inequality.
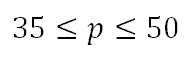
With a short glance, we can see that the inequality describes Ĺpĺ as being a value between 35 and 50, including those end values. We can graph this by placing the values 35 and 50 on a number line and shading all the values between them and including them. Here is what it would look like.
| |||
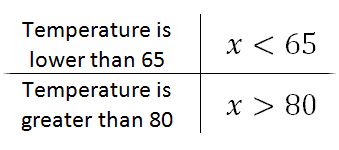
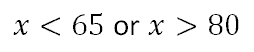
There is another type of compound inequality. Here is a situation that uses Ĺor.ĺ Homes in the north use either the furnace when it is cold or air conditioning when it is hot. All this air treatment can be costly. If Shantel in Chicago treats the air in her home when the temperature is either less than 650 F or greater than 800 F, letĺs represent this with inequalities.
We cannot collapse this compound inequality, but we can graph it.
We have to graph to the left of 65 and we also have to graph to the right of 80 and use open circles because there are no equal signs.
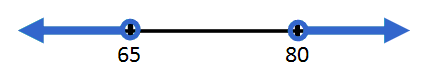
Notice how there is no shading between 65 and 80. This is because Shantel does not treat her air when the temperature is 65 to 80 degrees. Only when the temperature dips below 65 or rises above 80 will she operate air treatment.
| |||
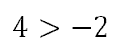
Letĺs look at a valid inequality. Since 4 is greater than -2, we can write the relationship like this.
If we were to either multiply each side by -0.5 or divide both sides by -2, we would get these values.
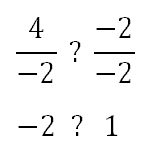
The question is, which inequality belongs between those two values, a greater than or a less than symbol? Clearly, -2 is a smaller value than 1. So, we need to place a less than symbol between them.
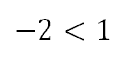
Notice how the inequality flipped from greater than to less than. This flipping of the inequality only happens when we divide or multiply both sides of an inequality by a negative value. Letĺs keep this in mind as we solve expressions that contain inequalities.
| |||
Sometimes we encounter inequality problems that require some cleanup before we can graph them. Take a look at these examples that demonstrate the need for cleanup. Example 1:
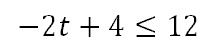
First, we have to add -4 to both sides to get our variable term alone.
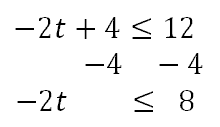
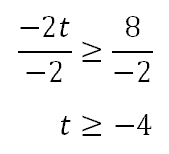
To get the Ĺtĺ alone, we have to divide both sides by -2; however, when doing so we have to flip the inequality. We only flip this inequality when we divide or multiply both sides by a negative value.
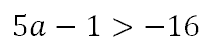
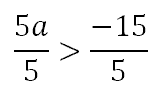
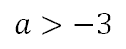
First, we have to add 1 to both sides to get our variable term alone.
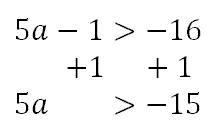
To get the Ĺaĺ alone, we have to divide both sides by 5; however, when doing do we have to flip the inequality? We only flip this inequality when we divide or multiply both sides by a negative value. Since we are diving by a positive value, we need not flip the inequality.
| |||
Try this lesson, which is closely related to the lesson above.
| |||

 esson: