Graphing Inequalities | ||
| ||
Introduction | ||
In this section, you will learn how to graph linequalities. Here are the sections within this lesson:
|
There are a series of steps to accomplish in order to graph inequalities. Here are those steps.
Use the examples below to help understand how these steps are accomplished.
| |
To graph linear inequalities in slope-intercept form, it is necessary to know how to graph a line. We already covered that lesson in a different section; so please review graphing lines before continuing. Let's start with an example.
Let's graph this inequality. We will place a point on (0,-5) and then use the slope. From the y-intercept, we will go up 2 units and then go right 3 units. This is the line.
Now we have to consider how the inequality affects the graph of the line. Since there is no equality, we are not interested in points that are actually on the line, only points that are off of the line. This means the line is not part of the solution. To show that it is not part of the solution, we make the line dashed, like so.
Next, we have to determine how the greater than affects the graph. The inequality means we want all the points where the y-value is less than "five less than 2/3 the x-value." To determine this, we simply test a point off of the line. Let us choose (0,0) because it is an easy point to work with.
To test the point, we will place in the value zero for 'x' and zero for 'y' and then examine the result.
Now, we determine if this result is true or false. Since "0 < -5" is false, (0,0) is not a solution of the inequality. This means the top section of the graph is not a solution. There are only two half-planes to consider for shading: either the upper half-plane or the lower half-plane. If the upper-half is not the solution, then it only makes sense that the bottom section of the graph is a solution.
To verify that our shaded region is correct, test the point (3,-4) into the original inequality. The point (3,-4) is clearly below the line, so we should get an inequality that is true.
The result is "-4 < -3" which is indeed true. Negative four is a number that is less than negative three. This shows us that all points below the line will result in true results within the inequality.
| |
In this section, we will deal with a line that is in standard form. Again, please review how to graph lines that are in standard form before proceeding. Here is example two.
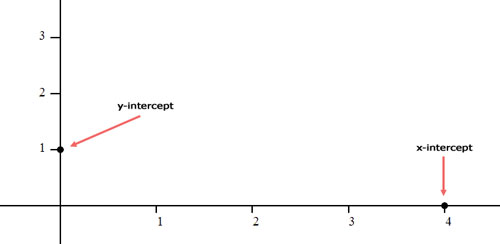
To graph this line, we will locate its intercepts. We will replace the x-value with zero and solve for 'y.' Likewise, we will replace the y-value with zero and solve for 'x.' Doing so yields (0,1) and (4,0). Let's place these points on a coordinate plane.
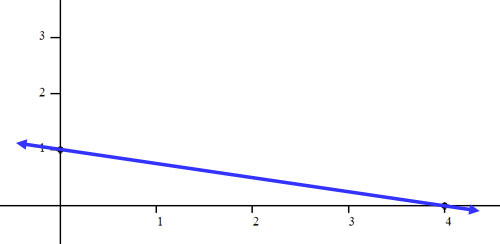
Next, we will determine if the line should be solid or dashed. Since there is an equal sign, the line must be solid. Here is the line.
The next step is to find out which side of the line to shade. This requires us to test a point off of the line. A great test point is (0,0).
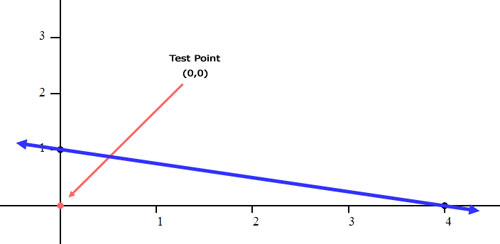
We will place zero in for 'x' and zero in for 'y.'
We are left with "0 > 4," which is a false statement. This means that our test point does not fall within the solution set. So, we need to shade the opposite side of the line that contains our test point. That shaded side must be above the line. That is where we will shade.
 ideo: Graphing Linear Inequalities in Standard Form ideo: Graphing Linear Inequalities in Standard Form uizmaster: Graphing Linear Inequalities in Standard Form uizmaster: Graphing Linear Inequalities in Standard Form
| |
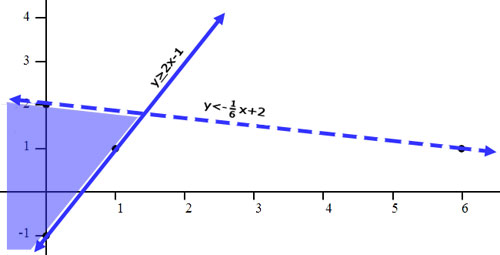
Graphing systems of linear inequalities is a little different than graphing systems of equations. Systems of equations has sophisticated techniques that does not require graphing the lines. On the other hand, graphing lines is a crucial part of graphing inequalities. Therefore, review our graphing lines lesson before proceeding. Here is the example we will be working with for this section.
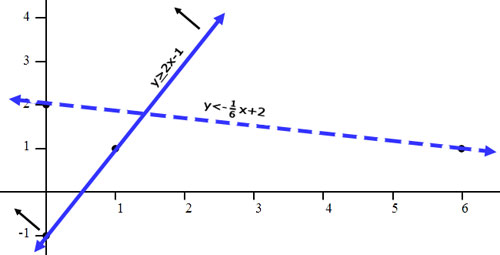
First, let's graph the equations. For the top equation, we start at the y-intercept, (0,-1), and go 2 up and 1 to the right. We get another point (1,1). For the bottom equation, we start at the y-intercept, (0,2), and go 1 down and 6 to the right. We get another point (6,1). Next, we have to determine which line is shaded and which one is not. The line with the equality -- the top line -- is solid. This is what the picture should look like without the shading.
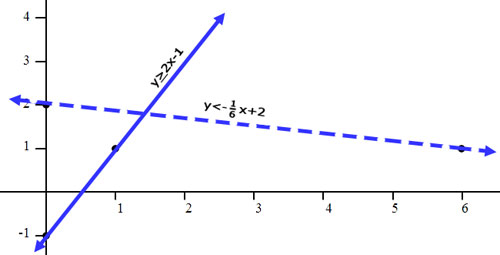
To shade, we need to figure out which side of each line to shade. Again, this is done with a test point. In both cases, we should use (0,0) because it is a point off of both lines. Here is the check for both lines.
In both cases, the result is true. Zero is greater than or equal to -1. Zero is less than 2. So, we need to shade on the side of the line that contains the origin, (0,0), for both lines. For the line y > 2x - 1, we have to shade above the line. To help aid in the shading process, we can place small arrows next to the lines to help us remember where to shade. Note the black arrows in the picture below.
For the line y < (-1/6)x + 2, we have to shade below the line. Small arrows will be placed next to the line to show where we need to shade.
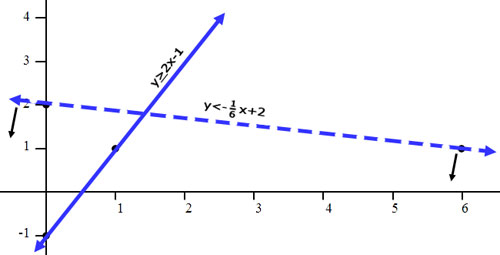
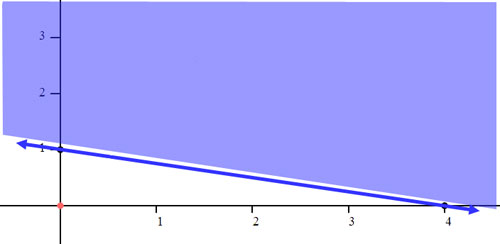
With all four arrows showing, we have an easier time discovering where to shade. The arrows will point to the correct section.
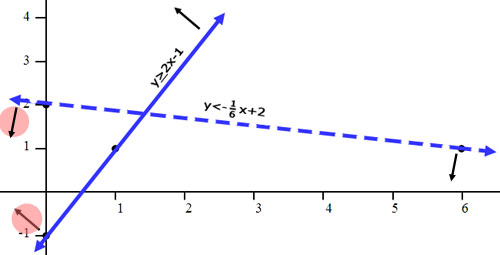
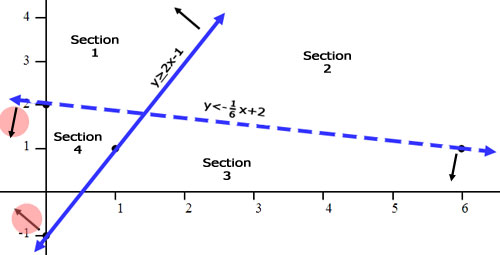
With four sections in the graph, we have to shade the correct section. The section we need to shade is the section where both arrows point. The picture below will help discover that section. Look at section 2. No arrows point to section 2; so, we will not shade there. Sections 1 and 3 only have one arrow point to it. We will not shade those sections as a result. Finally, we will notice how two arrows point to section 4, making it the correct section to shade.
Here is the final graph.
Watch our video on Graphing Systems of Inequalities. | |
Try our instructional videos to get a different perspective on the lessons above.
| |
Try our interactive quizzes to determine if you understand the lessons above.
Here are a few related quizmasters.
| |
Here is an activity for the lessons above.
| |
Try this advanced lesson, which is closely related to the lessons above.
| |
 ctivity:
  esson: